2023-11-20 09:44:41
What is with this chart?
What is with this chart?
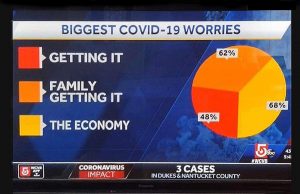
A fellow teacher, Laura Deschaines, saw this chart on the news the other night. What do you notice? Does anything seem amiss? What should it look like?
For Adventurer members we have an editable Word docx, an Excel sheet, and solutions.
Comments (0)
Display 1 - 10 Of total 0
Giant iceberg breaks off from Antarctica
The crac...
Fireworks on your calculator
Let your students experiment wit...
Doubling your money
My friend and I were arguing about how lon...
Someone ate my cake!
🍰In this updated activity, students anal...
Mark Zuckerberg and Priscilla Chan to give away 99% of their shares of Facebook
That sounds like an awful lot of their Fac...
Pixar versus DreamWorks (2016 )
This activity has been updated – please see:...
It's latke time
In Leslie's family it is tradition...
Big bucks 2023
Updated!
When soccer great, Lionel Messi play...
Stone Ice Storage
In this activity, students will estimate the...
Pascal's Triangle coloring and Probability
Pascal's Triangle and Probability - Thi...