2023-11-20 09:44:27
Geometry of Flooding
Geometry of Flooding
In 2010, March was so rainy that flooding was the topic of every newscast and many, many conversations. To this day, the March 2010 floods were described as “once-in-a-generation” river levels in Massachusetts, experiencing the highest levels in 23 years and setting new records.
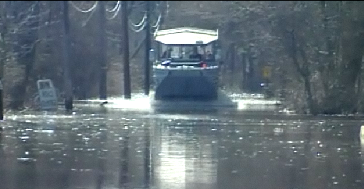
The picture shows how students went home from school in Wayland Mass. on March 31st - on a Duckboat.
This two-page investigation asks students to calculate the volume of water generated by inches of rain spread over the surface area of Massachusetts. Specific river catchment areas are then considered to understand the actual voluminous rise of the Sudbury River. Once the volume of water is calculated, students are asked to find the approximate river depth change. This activity could be used in any science or math class, especially if flooding is in the news in your area or nationally.
CCSS: 5.MD, 6.G, 6.EE, 6.RP, 7.G, 7.RP, HSG, HSF
Comments (0)
Display 1 - 10 Of total 0
USPS needs help!
The U.S. Postal Service has been in the news lat...
Thank you, mother and father, for all of those diapers (Updated)
Which is a better deal, cloth or disposable diaper...
Why isn't the World Cup happening now?
The World Cup Finals is only played every 4 ...
Huge diamond found in Canada
552-carat diamond found in Diavik Mine, Nort...
Ramen noodle heist
In 2018, a truck trailer was stolen from a parki...
Banana Art "Comedian"
What do you think this...
Cost of light bulbs
This activity has been updated (2026). See t...
How steep is this treadmill?
Every year, even older students still ...
The odds of horse race betting
Rich Strike surprised everyone at the Kentucky D...
Hoarding stopped!
A Danish market found an...